| Metu Mattuu | |
|---|---|
| Town | |
 | |
| Coordinates: 8°18′N 35°35′E / 8.300°N 35.583°E / 8.300; 35.583 | |
| Country | |
| Region | |
| Zone | Illubabor |
| Elevation | 1,605 m (5,266 ft) |
| Population | |
| • Total | 28,782 |
| Time zone | UTC+3 (EAT) |
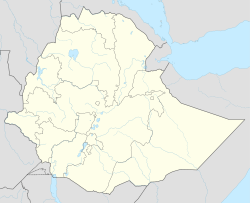
Metu (Oromo: Mattuu) is a market town and separate woreda in south-western Ethiopia. Located in the Illubabor Zone of the Oromia along the Sor River, this town has a latitude and longitude of 8°18′N 35°35′E / 8.300°N 35.583°E / 8.300; 35.583 and an altitude of 1605 meters. Metu was the capital of the former Illubabor Province from 1978 until the adoption of the new constitution in 1995.
Metu has been an important market of the coffee trade, with several foreigners residing in the town as early as the 1930s to buy the crops from local farmers. At this early date, the town was connected by telephone to Gore and Addis Ababa. The town's source of electricity is the nearby Sor Hydroelectric Station. The city also has a high school and hospital.
Metu is known for its local waterfalls, the best known being the Sor Falls and their surrounding forest with its wildlife.
History
On 9 July 1927, the Greek nationals T. Zewos and A. Donalis were awarded a contract to link the town and Gore by road with Gambela, a distance of 180 kilometers. In the 1930s, Metu was the last stop before reaching Gore. At the time it was a center for mule caravans and later also as a terminal for the Ethiopian Transport Motor Company.
The private weekly Urji reported 11 July 1995 that some 400 prisoners reportedly escaped when a grenade was set off at the Bishari prison in Metu. The prison guards were killed immediately as well as at least six other people.
Demographics
The 2007 national census reported a total population for Metu of 28,782, of whom 14,400 were men and 14,382 were women. The majority of the inhabitants practised Muslim, with 47.55% of the population reporting they observed this belief, while 26% of the population said they were Ethiopian Orthodox, and 26% were Protestant.
Climate
| Climate data for Metu (1971–2000) | |||||||||||||
|---|---|---|---|---|---|---|---|---|---|---|---|---|---|
| Month | Jan | Feb | Mar | Apr | May | Jun | Jul | Aug | Sep | Oct | Nov | Dec | Year |
| Mean daily maximum °C (°F) | 27.5 (81.5) |
28.9 (84.0) |
29.4 (84.9) |
29.3 (84.7) |
27.1 (80.8) |
25.1 (77.2) |
23.4 (74.1) |
23.6 (74.5) |
24.6 (76.3) |
25.7 (78.3) |
26.0 (78.8) |
27.0 (80.6) |
26.5 (79.6) |
| Mean daily minimum °C (°F) | 9.1 (48.4) |
10.8 (51.4) |
12.4 (54.3) |
13.1 (55.6) |
13.5 (56.3) |
13.3 (55.9) |
13.1 (55.6) |
13.0 (55.4) |
12.9 (55.2) |
12.3 (54.1) |
10.2 (50.4) |
8.2 (46.8) |
11.8 (53.3) |
| Average precipitation mm (inches) | 37.0 (1.46) |
38.0 (1.50) |
76.0 (2.99) |
88.0 (3.46) |
227.0 (8.94) |
272.0 (10.71) |
311.0 (12.24) |
294.0 (11.57) |
306.0 (12.05) |
140.0 (5.51) |
70.0 (2.76) |
28.0 (1.10) |
1,887 (74.29) |
| Average relative humidity (%) | 59 | 55 | 57 | 65 | 76 | 82 | 86 | 86 | 83 | 76 | 71 | 65 | 72 |
| Source: FAO | |||||||||||||
Notes
- Matt Philips and Jean-Bernard Carillet, Ethiopia and Eritrea, third edition (n.p.: Lonely Planet, 2006), p. 240
- ^ "Local History in Ethiopia" Archived 2008-10-02 at the Wayback Machine (pdf) The Nordic Africa Institute website (accessed 27 November 2007)
- World Small Hydropower Development Report 2013. United Nations Industrial Development Organization (UNIDO) and International center on small hydro power (ICSHP), p. 1.
- Pankhurst, Richard K. P. (1968). Economic History of Ethiopia. Addis Ababa: Haile Selassie I University. pp. 290f.
- 2007 Population and Housing Census of Ethiopia: Results for Oromia Region, Vol. 1 Archived 2011-11-13 at the Wayback Machine, Tables 2.1, 2.5, 3.4 (accessed 13 January 2012)
- "CLIMWAT climatic database". Food and Agriculture Organization of United Nations. Retrieved 21 June 2024.